Apple Health PowerBi Dashboard
One thing that I have always wanted to do is explore the data that my Apple Devices capture about my health and movement and exercise, the problem is that you can’t do that unless your using Apple’s tools and furthermore Apple doesn’t have a way for you to see that data outside of the ecosystem.
What Apple does however let you do is export your data from Apple Health and that is what I am going to be doing here to create my own Apple Health Dashboard in Microsoft PowerBi.
Python
The first thing I needed, that I didn’t have on my development workstation was Python, it was recommended that I get Anaconda as it comes with lots of tooling right out of the box, so that is what I did, downloading the installer from here and followed through the steps in the installer, I didn’t change anything, I just followed the default steps.
Clone The Repo
Now that I have Python installed, I needed the scripts that are going to allow conversion of the Apple Health XML output into something usable, for that Mark Koester has a git hub repo with a Jupyter notebook that fits the bill.
I cloned the repo to a location on my machine. I have forked it so if you want to pull it you can, use the command below if you are using GitHub Desktop.
gh repo clone RichInSQL/qs_ledger
Export Apple Health Data
Exporting the data from Apple Health is easy, I did it from my iPhone.
Open Apple Health

From the summary page, click your profile picture
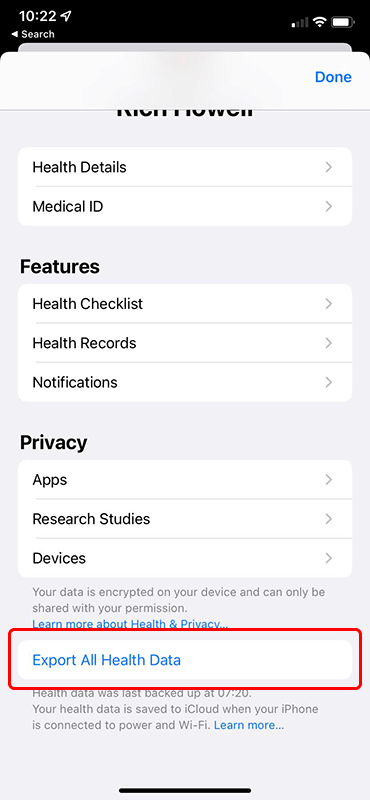
Scroll to the bottom and select Export All Health Data
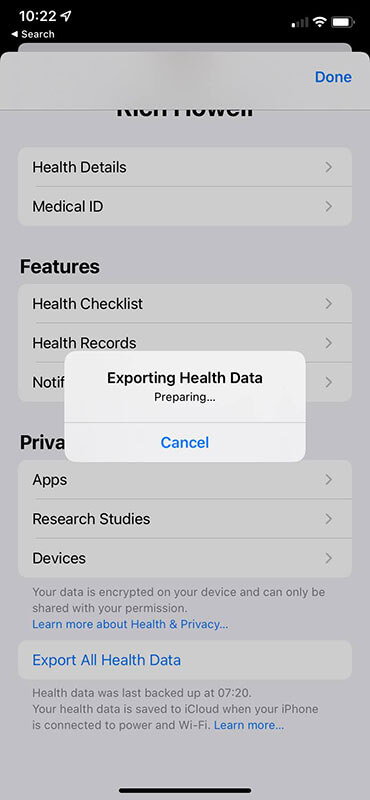
Depending on the amount of data you have, this might take a while.
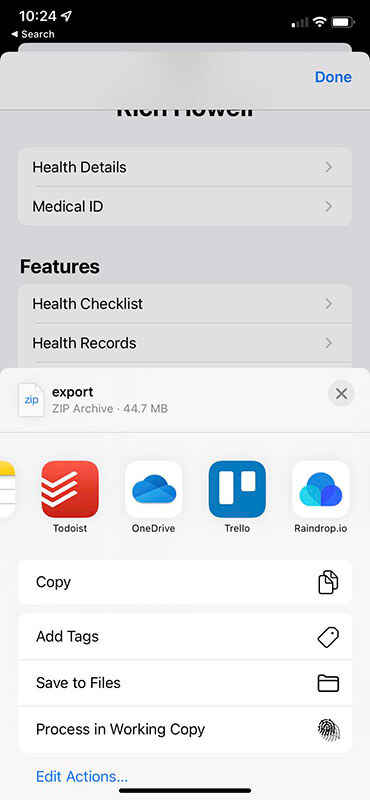
Once this is complete a share sheet will come up asking where you would like to save it, as I have One Drive installed on my phone, I uploaded it there so I could access it from my desktop.
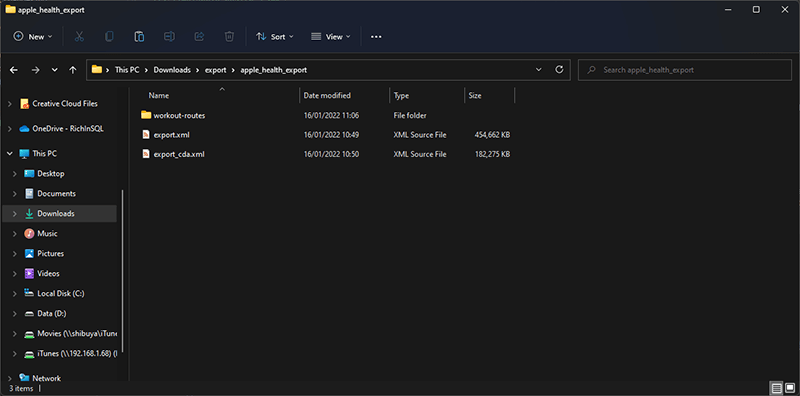
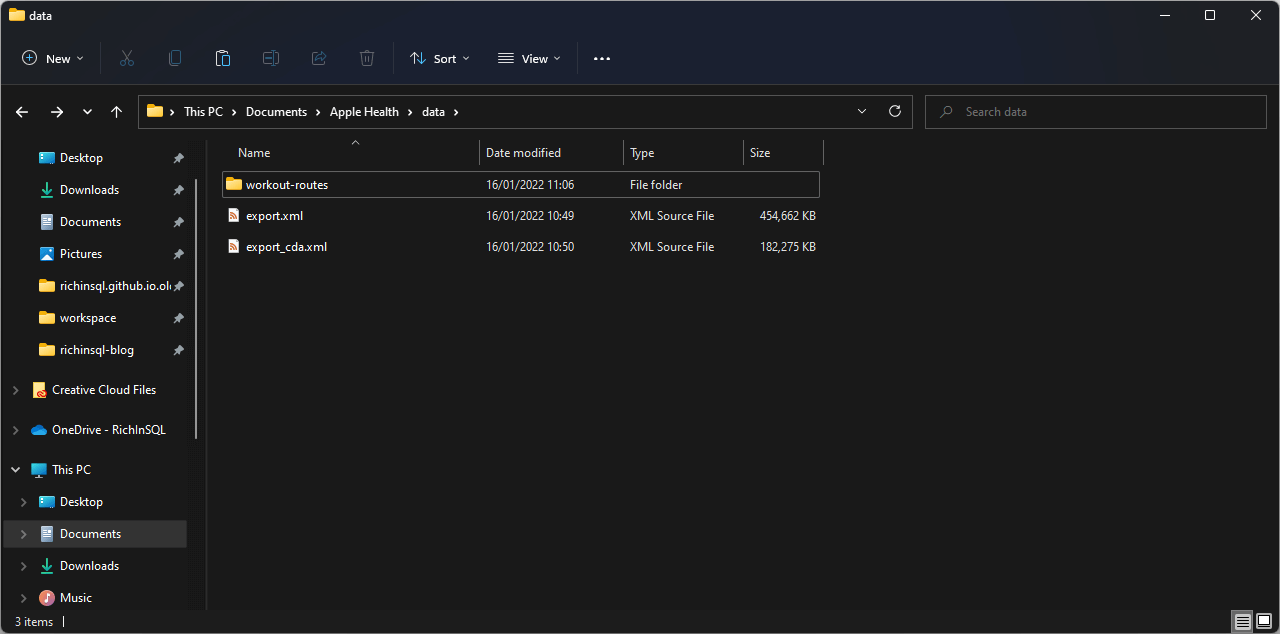
The health data comes out of the health app in a zip file called export.zip, so once it was on my local machine, I just had to unzip it, there should be files that look like this inside;
Move Some Files
Remember cloning that GitHub repo before? I now needed to copy the apple_health folder somewhere else, this step was optional, but it saved me messing around with my commits in Git, I didn’t want my health data uploaded there as the repo is public, so I copied the apple_health folder to My Documents
I then opened up the extracted health data that I unzipped earlier; it should now look something like this.
I then copied all the files into the apple_health\data folder giving me something that looks like this
Convert The Data
Now that the structure is all set, I went ahead and started the conversion of the data into CSV files. To do that I need to open the jupyter notebook, fortunately Anaconda comes with jupyter
- Start
- All Apps
- Anaconda
- jupyter notebook

This then starts a jupyter notebook instance in the web browser,
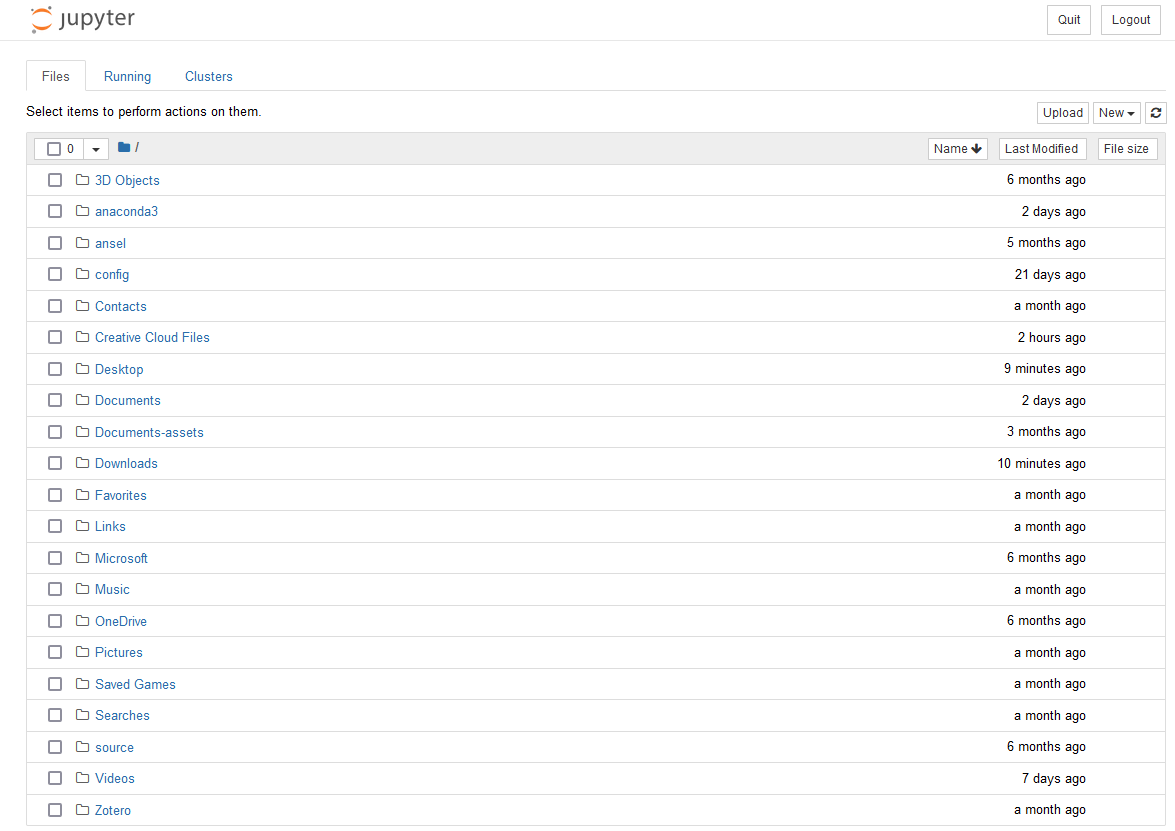
Navigate to the apple_health folder that I copied to my My Documents folder
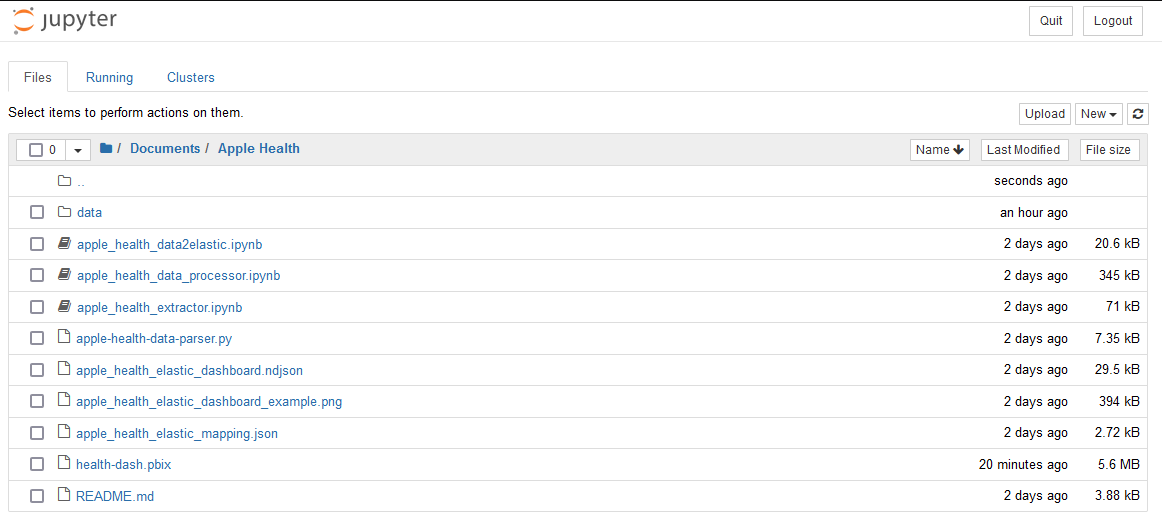
click the apple_health_extractor.ipynb this will open another tab with the jupyter notebook inside
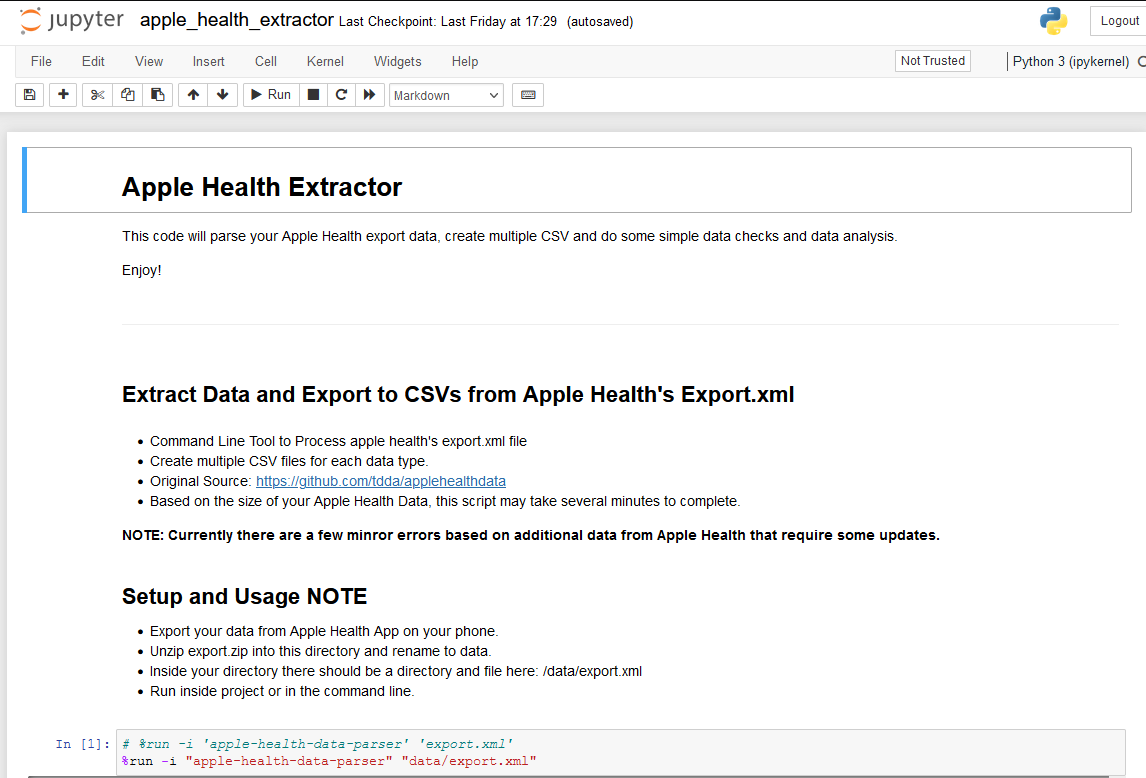
Highlight the following line inside the notebook
%run -i "apple-health-data-parser" "data/export.xml"
Press SHIFT & ENTER, this will execute the command and generate the output CSV files, these will be placed in the apple_health\data which should now look something like this

Clean up the files
For my dashboard I made use of the following 5 files
- BodyMass.csv
- DietaryWater.csv
- DistanceWalkingRunning.csv
- HeartRate.csv
- StepCount.csv
I cleaned the files up by removing the following columns
- sourceName
- sourceVersion
- device
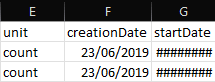
I also cleaned up the creationDate column by removing the time zone offset and then saving the creation date in excel as a short date
I then created a new file called Dates.csv and took a copy of all of the creationDates from the above files and pasted them into the new Dates.csv, then removed duplicates in Excel
- Highlight the column
- Click the Data tab
- Remove Duplicates
- Save the File as CSV
Preparing PowerBi

I needed a date table, this is a table that would bring all the datasets together and allow me to filter the data based on a range in time, remember that Date.csv we created earlier, I now need to import that into PowerBi and create some additional columns.
We should end up with a date table that looks something like this once finished

Now, let’s import the CSV files that we are going to be using, as I mentioned above, I am making use of
- BodyMass.csv
- DietaryWater.csv
- DistanceWalkingRunning.csv
- HeartRate.csv
- StepCount.csv
So let’s bring them into our Model, from the Home Tab select Get Data and choose Text/CSV and select the files that you would like to bring into your Model.
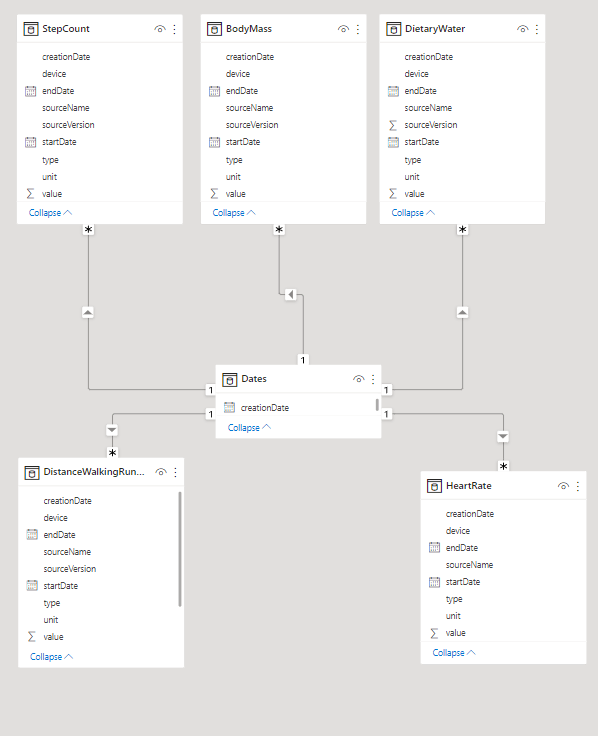
Once the files are all imported you should end with something like this in your Model
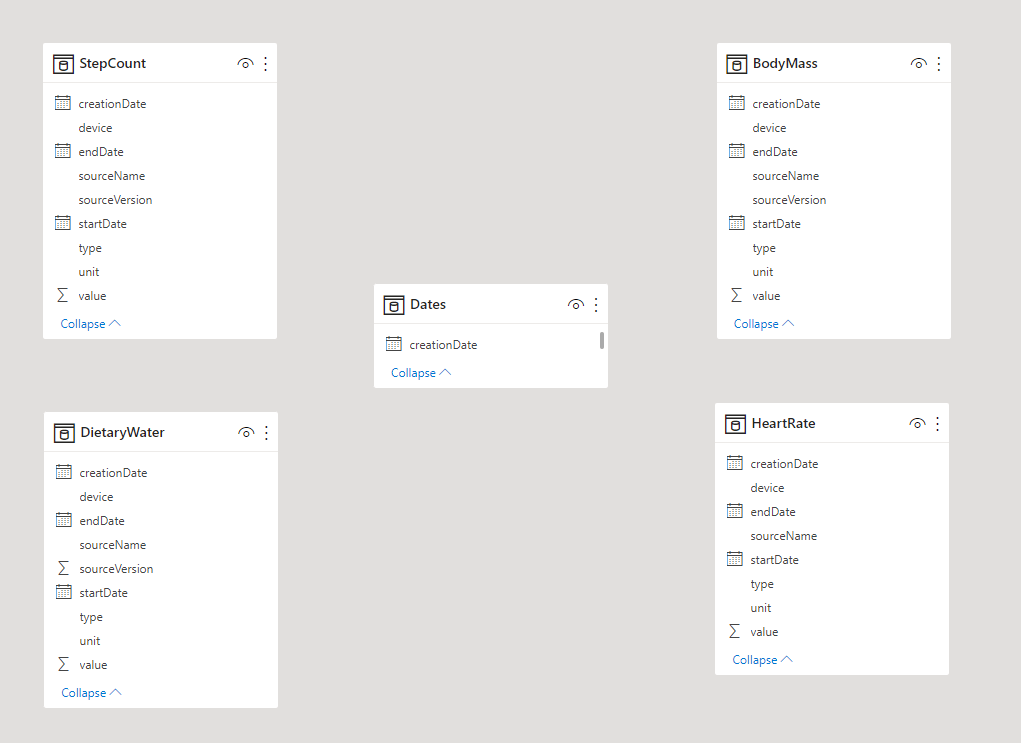
Create the relationship by dragging the CreationDate column from the dates table and dropping it onto the creationDate column of the other tables one at a time which should give you a model that looks like this
I then started by bringing all my step data into the PowerBi canvas, I created bar charts which show how many steps I did yearly, monthly and daily this shows me which of the years, months and days I walk the most.
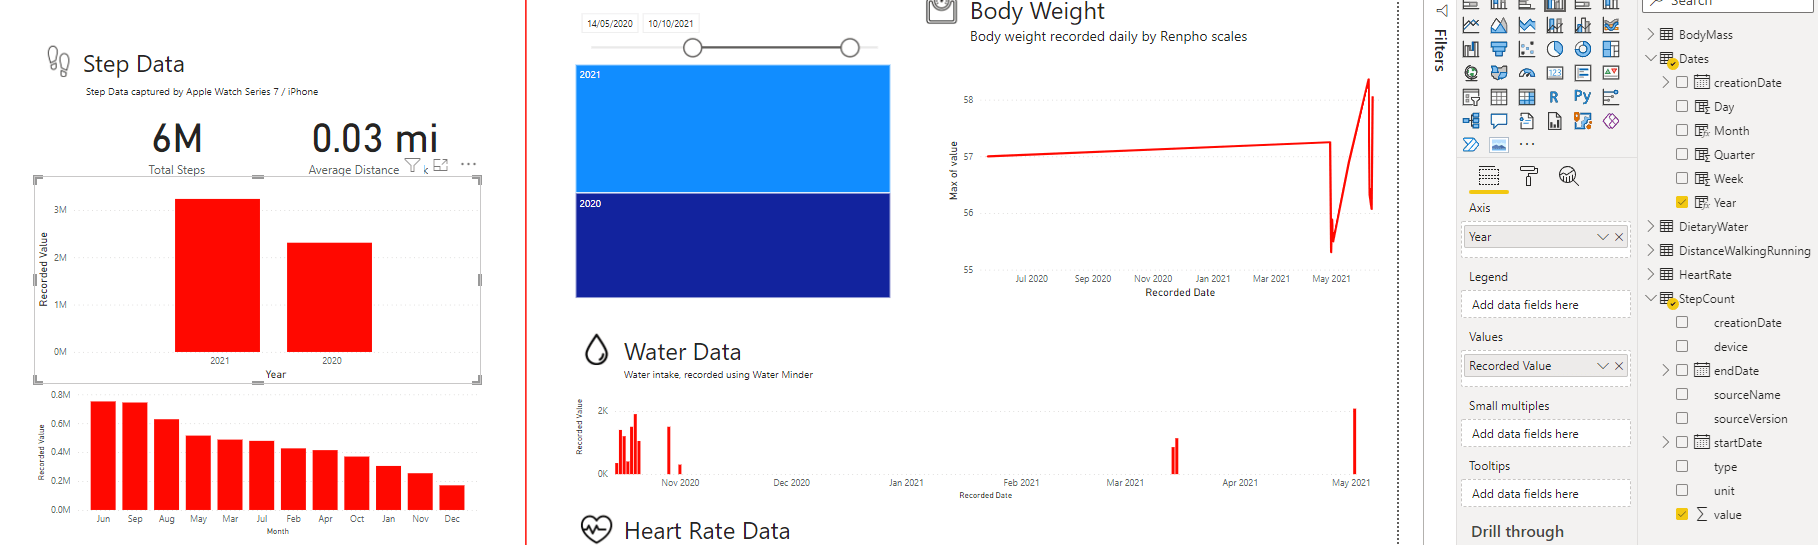
I repeated this process for the other visuals on the Canvas with the exception of Average Distance which uses two measures, I first created an average measure to get me the average value of Distance Walked.
Average = AVERAGE(DistanceWalkingRunning[value])
I then needed a measure to get the selected unit that had been used to record the walk
Selected Unit = SELECTEDVALUE(DistanceWalkingRunning[unit])
These were then concatenated together and rounded to give a clean visual
Card Values = ROUND(DistanceWalkingRunning[Average],2) & " " & DistanceWalkingRunning[Selected Unit]

Time To Publish Publishing
I am now able to publish this dashboard to the PowerBi Server Free Plan where I can manipulate it, I can’t share it with others or embed it though as that requires a PowerBi Pro plan.
Final Thoughts
There isn’t a way to automate the export of the Apple Health data so now this would have to be done ad-hoc and then converted into the CSV files required, as long as the format of these files doesn’t change the PowerBi report will still function, but it would be nice if there was a way to automate the process in some way.
This was a good challenge for me, learning about converting data in Python and then loading it into PowerBi, there was a bit more effort required to get the files into a working state than I thought there might be but the solution works none the less.